Project Aim:
The aim of this project is to gather and provide crucial salinity data to Andrew Wooldridge, Salinity Technical Officer at the Basin Salinity Program, Department of Climate Change, Energy, Environment and Water, to fill the gaps within the E-Spade database.
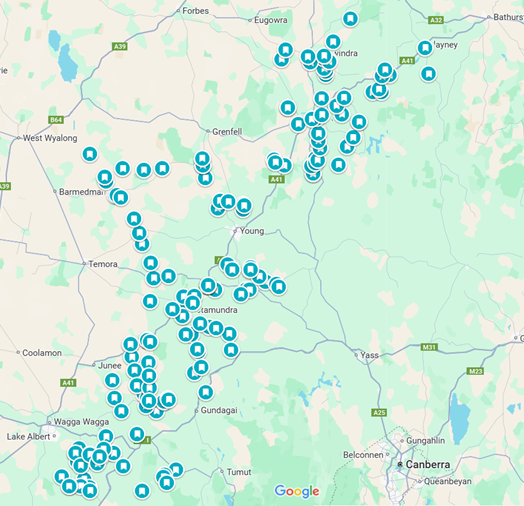
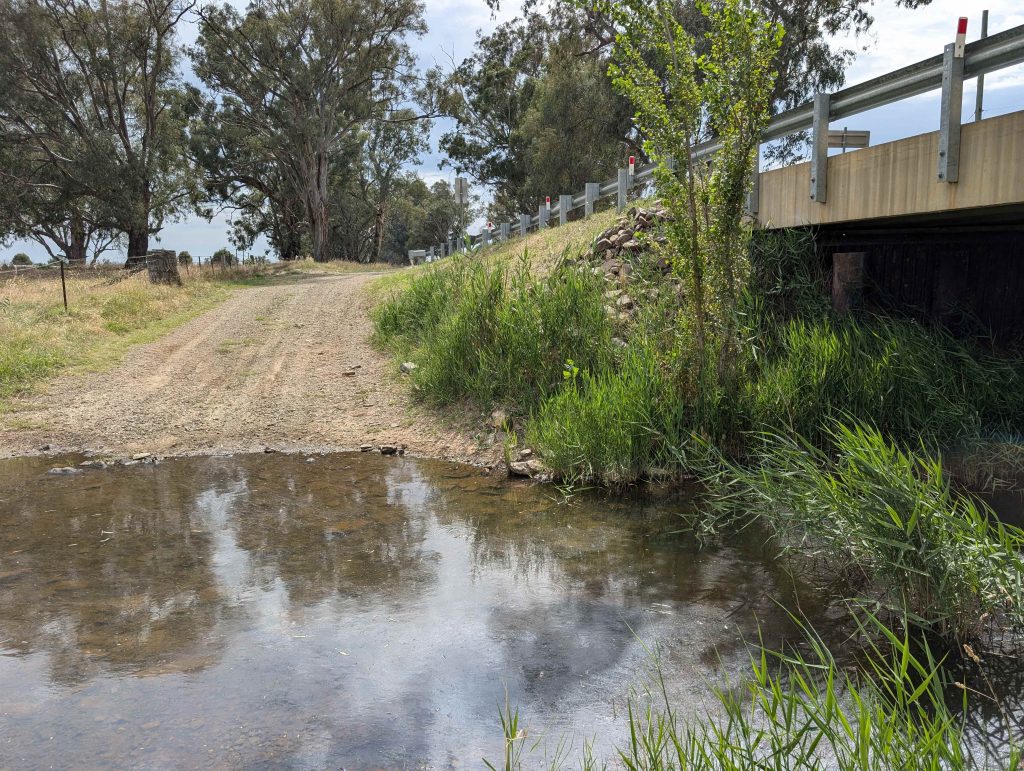
The project involves testing multiple catchments, waterways, and areas where data is missing, either due to a lack of water monitors or insufficient knowledge in that catchment. Since 2022, water samples from creeks and waterways have been collected routinely during both wet and dry periods to assess the salinity levels. This data helps to understand how salt is moving through the landscape, and what could be causing the problems is it natural or manmade. Over time if and area has indicated very low salinity we have stopped collection for these areas to focus on increasing data collection in identified salty areas to determine the sources and causes of salinity.
Over the years we have collated the data, created maps, Power Points of the different salinity loops with photo points and GPS points to that the information is not lost and can be replicated in years to come. Additionally, we have engaged local farmers, held workshops and talks with Landcare groups to raise awareness, educate, and increase local knowledge of salinity issues and the program.
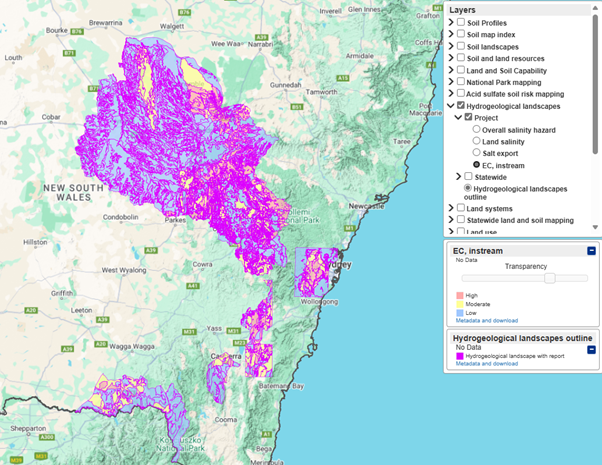
As shown on the eSPADE map (Picture 1), there is a lot of missing data across NSW. However, through ongoing testing, we are steadily progressing toward the goal of covering a large portion of the region ranging from the North (Blayney) to South (Henty) with comprehensive salinity data. This information will be used to generate detailed reports that provide farmers and industry professionals with accurate overviews of areas with varying salinity levels. These reports will include management recommendations based on the geological, hydrological, and land management characteristics specific to each area.
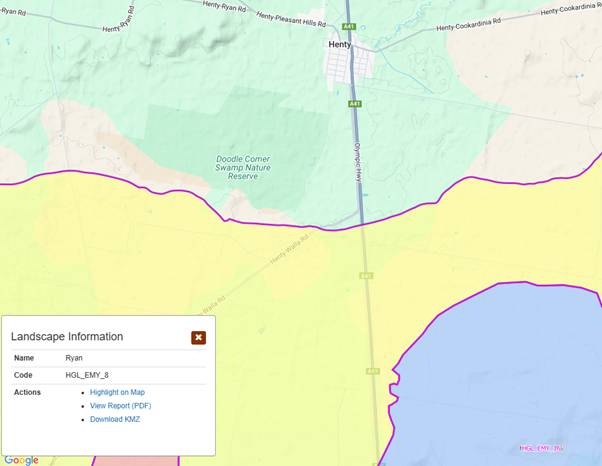
To access the relevant data and reports, click the link to the eSPADE website, select Hydrogeological Landscapes from the drop-down box on the right side, and choose one of the four available options to view different data sets or access the Hydrogeological Landscape reports. This resource, along with the overall project, is critical for making informed land management decisions.
Resource:
Hydrogeological Landscapes for the Eastern Murray Catchment: View Report (PDF)